SeqMonk Screenshots
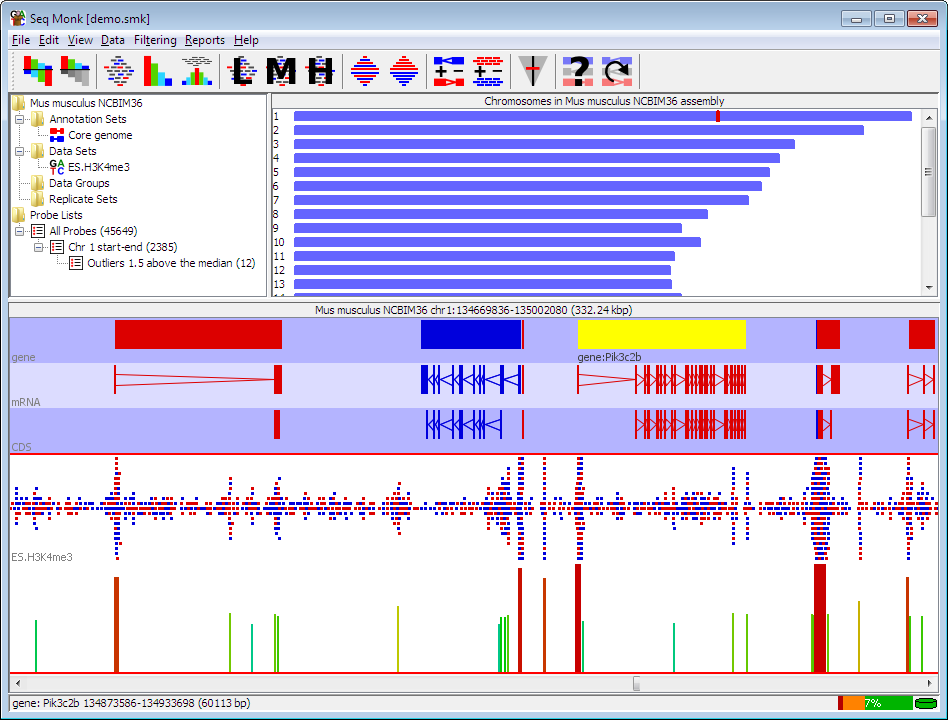
- Main Window
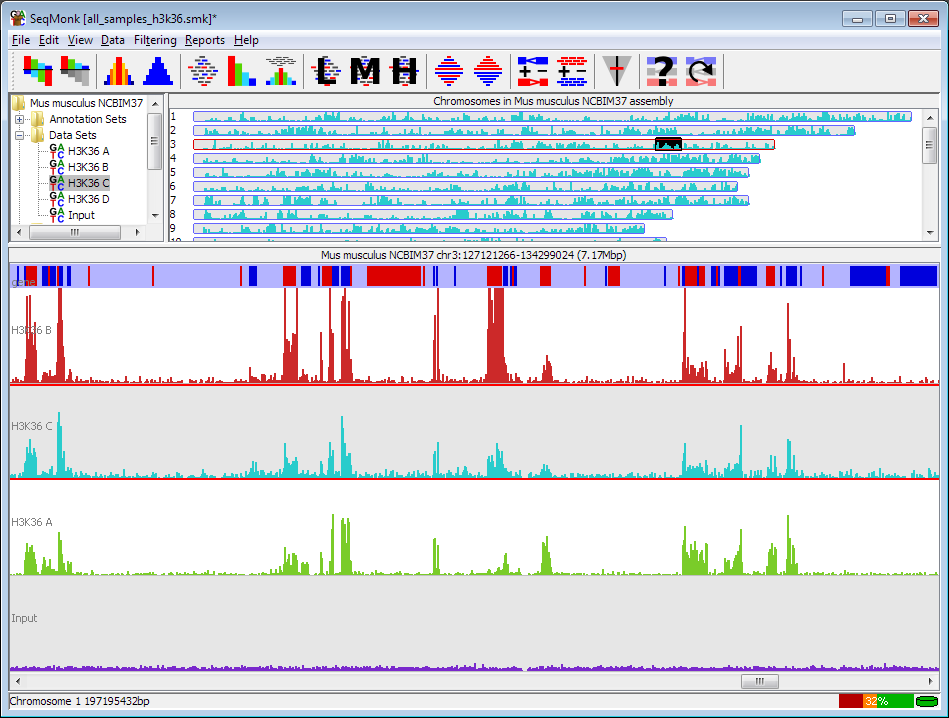
- Main Window 2
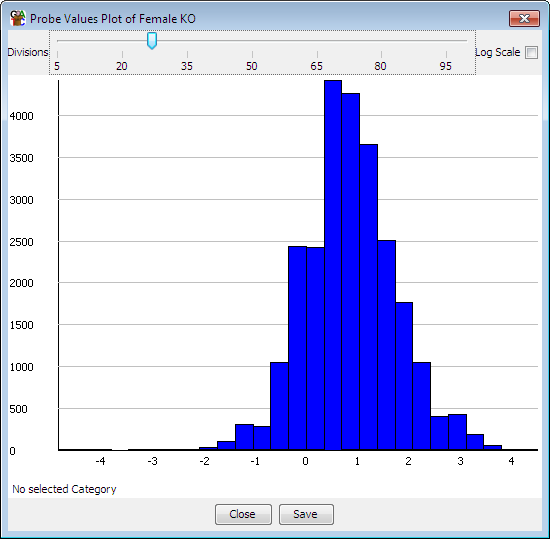
- Probe Value Histogram
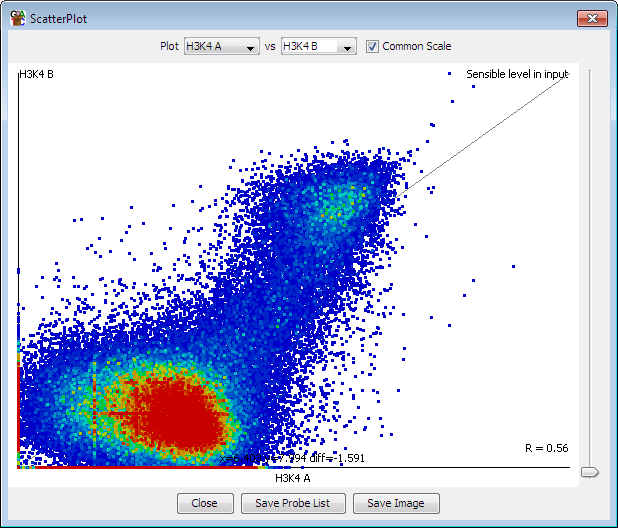
- Scatterplot
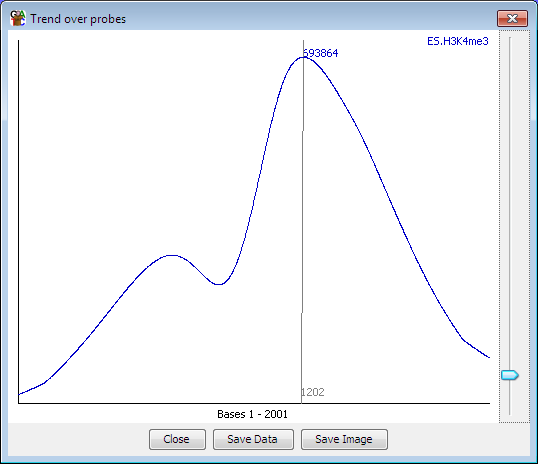
- Probe Trend Plot
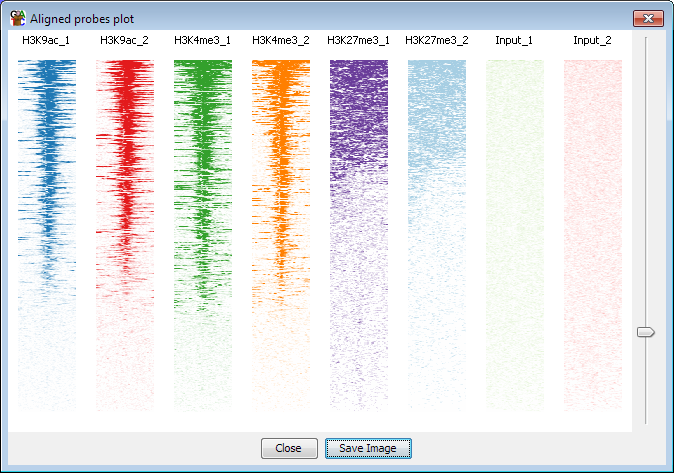
- Aligned Probes Plot
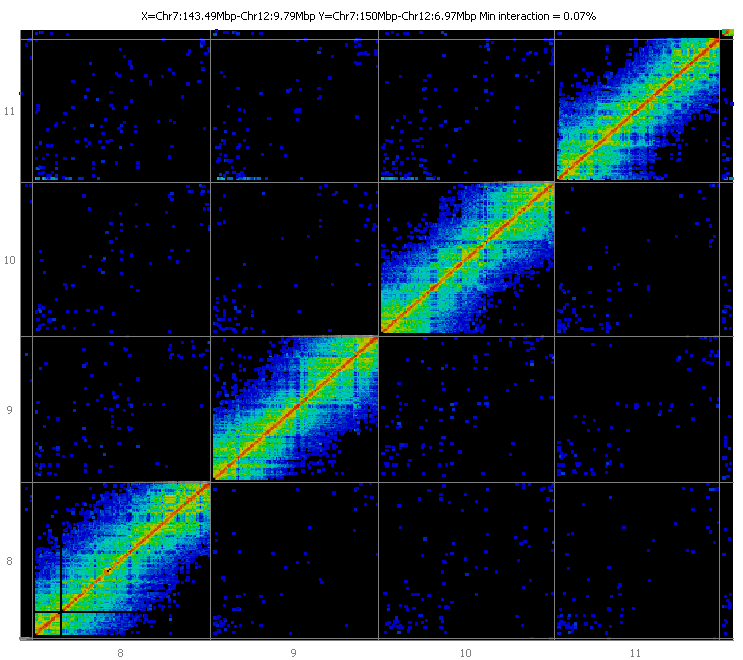
- HiC Interaction Plot
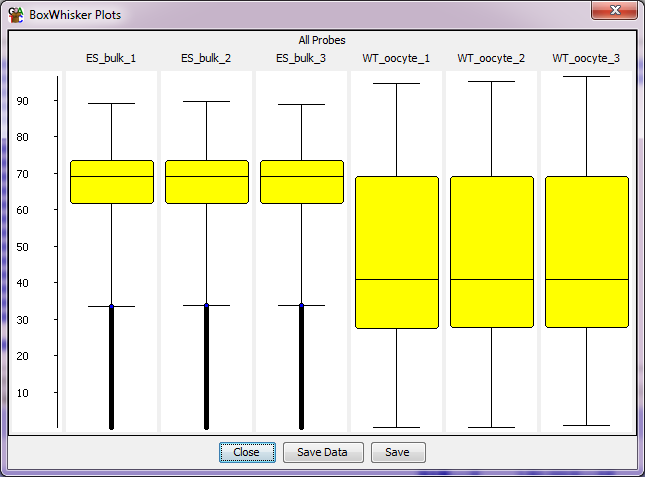
- Boxwhisker Plot
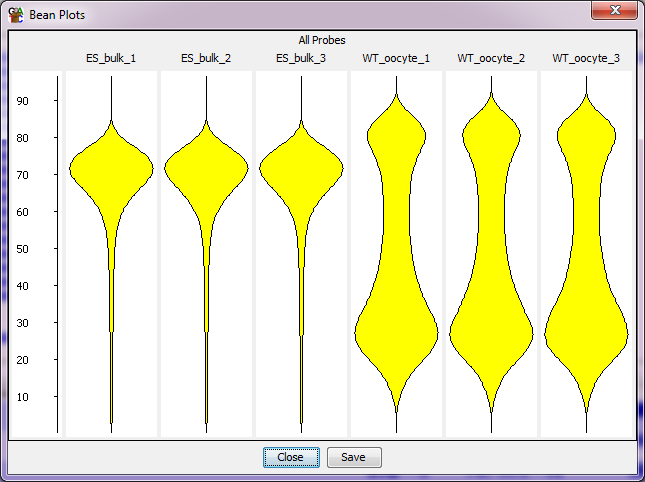
- Bean Plot
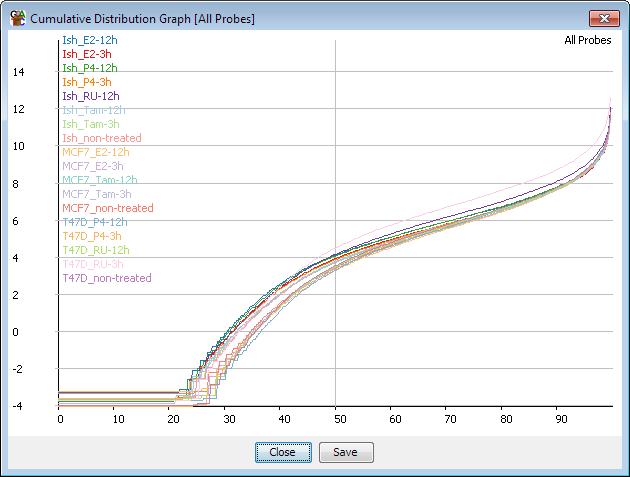
- Cumulative Distribution Plot
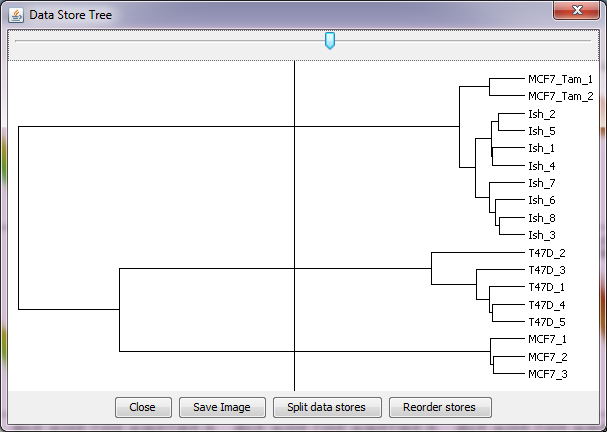
- Data Store Tree
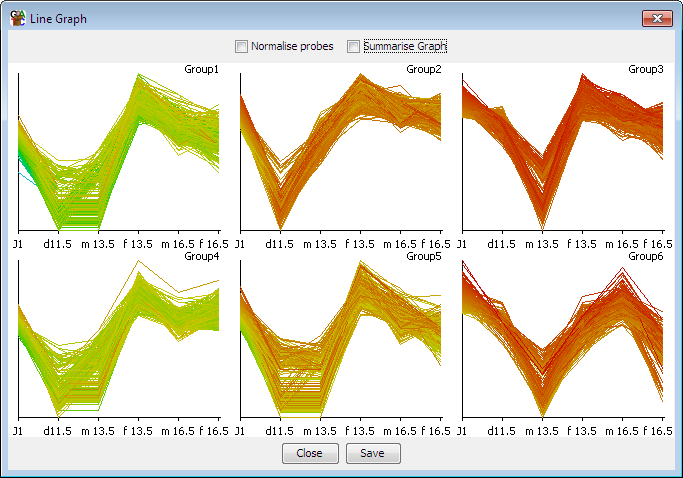
- Line Graph
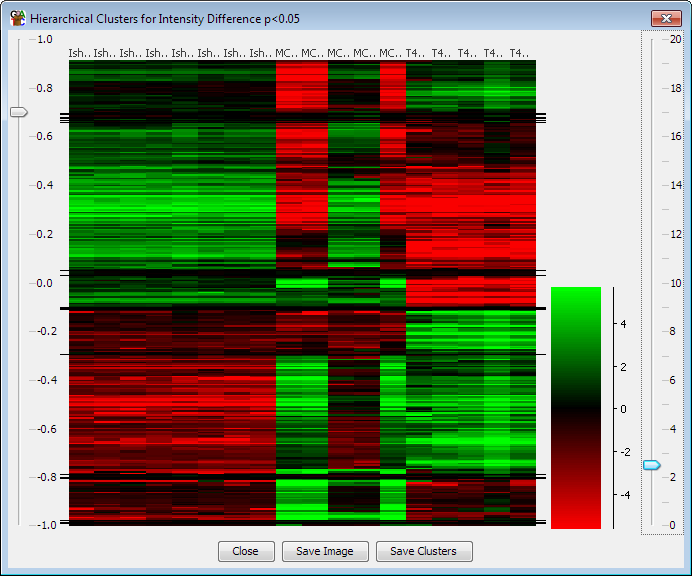
- Hierarchical Cluster Plot
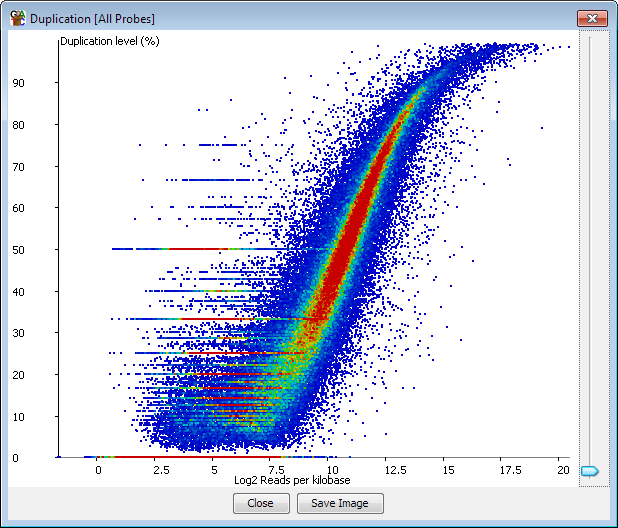
- Duplication Plot
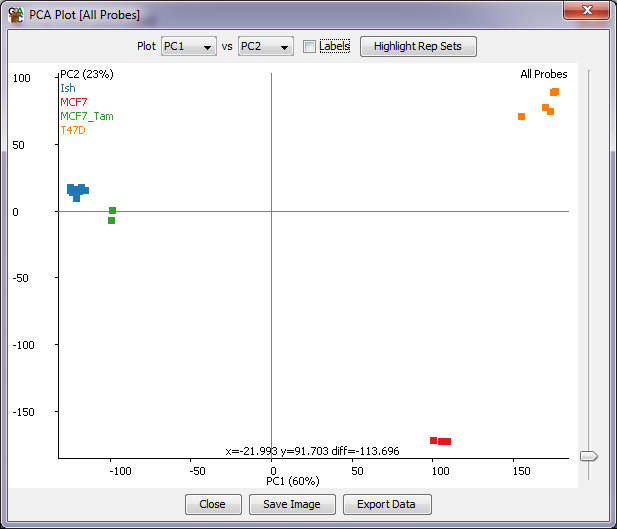
- PCA Plot
Main Window
Main Window 2
Probe Value Histogram
Scatterplot
Probe Trend Plot
Aligned Probes Plot
HiC Heatmap Plot
BoxWhisker Plot
Bean Plot
Cumulative Distribution Plot
Data Store Tree
Line Graph
Hierarchical Cluster Plot
Duplication Plot
PCA Plot