| Name | Last modified | Size | Description | |
|---|---|---|---|---|
| Parent Directory | - | |||
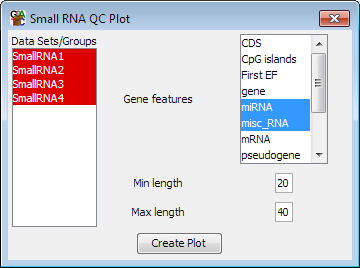
| 3.2.23 The Small RNA..> | 2020-07-20 14:44 | 858 | ||
| 3.2.5 The Reading Le..> | 2020-07-20 14:44 | 1.3K | ||
| 3.2.27 The Strand Bi..> | 2020-07-20 14:44 | 687 | ||
| volcano_plot.png | 2020-07-20 14:44 | 17K | ||
| pca_plot.png | 2020-07-20 14:44 | 32K | ||
| domainogram.png | 2020-07-20 14:44 | 84K | ||
| boxwhisker_plot.png | 2020-07-20 14:44 | 15K | ||
| 3.2.2 The DataStore ..> | 2020-07-20 14:44 | 933 | ||
| ma_plot.png | 2020-07-20 14:44 | 23K | ||
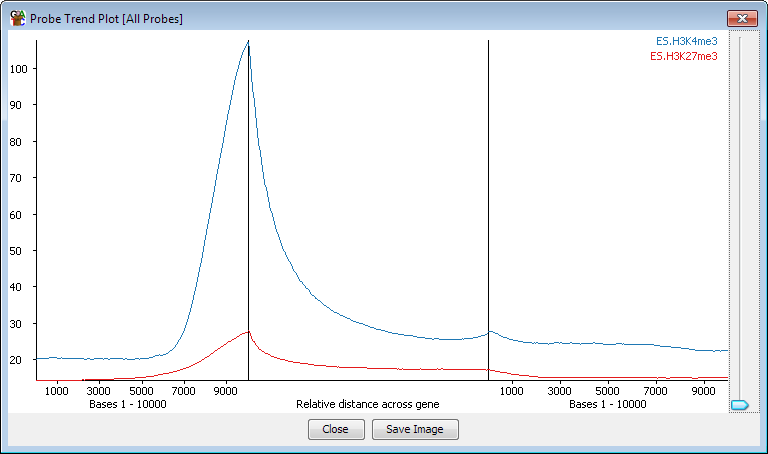
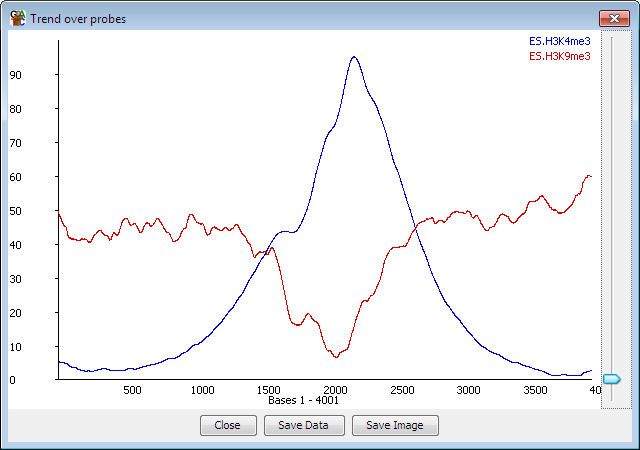
| 3.2.6 The Probe Tren..> | 2020-07-20 14:44 | 2.9K | ||
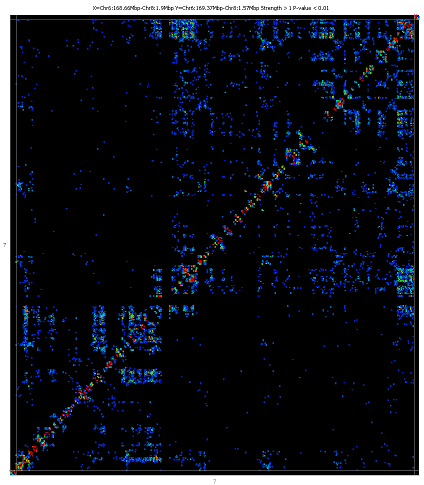
| hic_heatmap.png | 2020-07-20 14:44 | 62K | ||
| quantitation_trend_p..> | 2020-07-20 14:44 | 13K | ||
| quantitation_trend_o..> | 2020-07-20 14:44 | 15K | ||
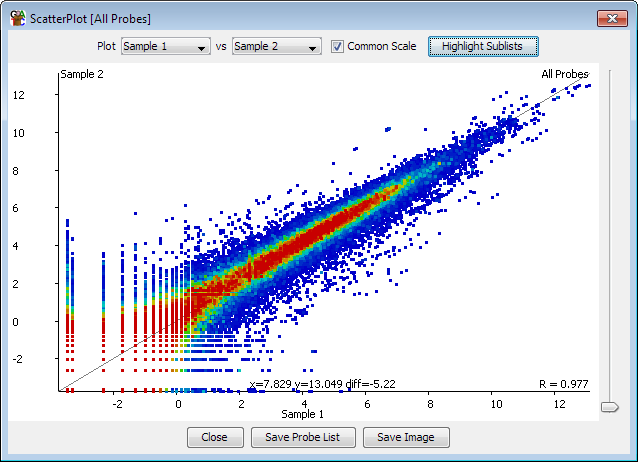
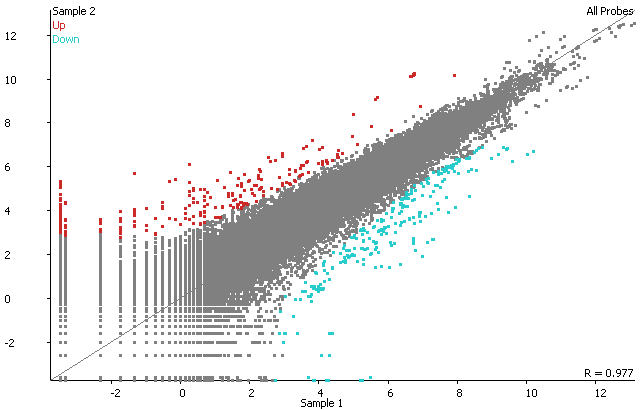
| scatter_plot.png | 2020-07-20 14:44 | 32K | ||
| datastore_tree.png | 2020-07-20 14:44 | 9.9K | ||
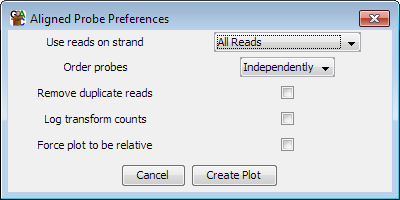
| 3.2.7 The Aligned Pr..> | 2020-07-20 14:44 | 1.8K | ||
| distribution_plot.png | 2020-07-20 14:44 | 16K | ||
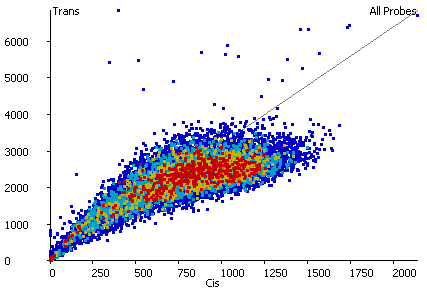
| 3.2.16 The HiC Cis-T..> | 2020-07-20 14:44 | 962 | ||
| starwars_plot.png | 2020-07-20 14:44 | 12K | ||
| domainogram_options.png | 2020-07-20 14:44 | 11K | ||
| 3.2.25 The PCA Plot...> | 2020-07-20 14:44 | 1.9K | ||
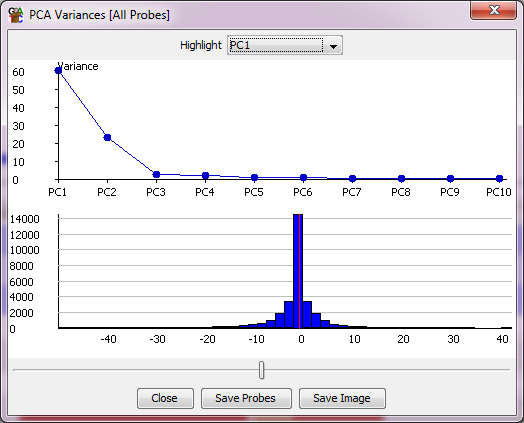
| pca_variances.png | 2020-07-20 14:44 | 21K | ||
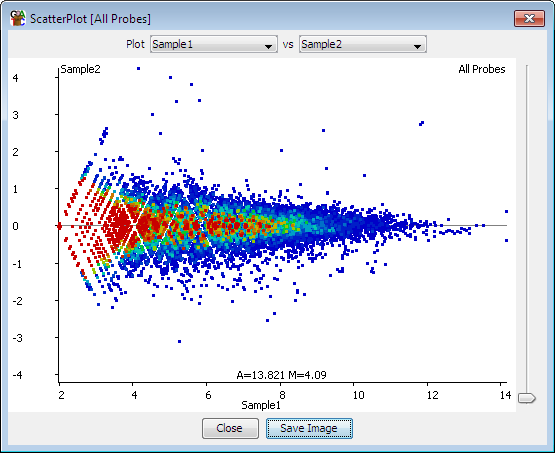
| 3.2.8 The Scatter Pl..> | 2020-07-20 14:44 | 2.5K | ||
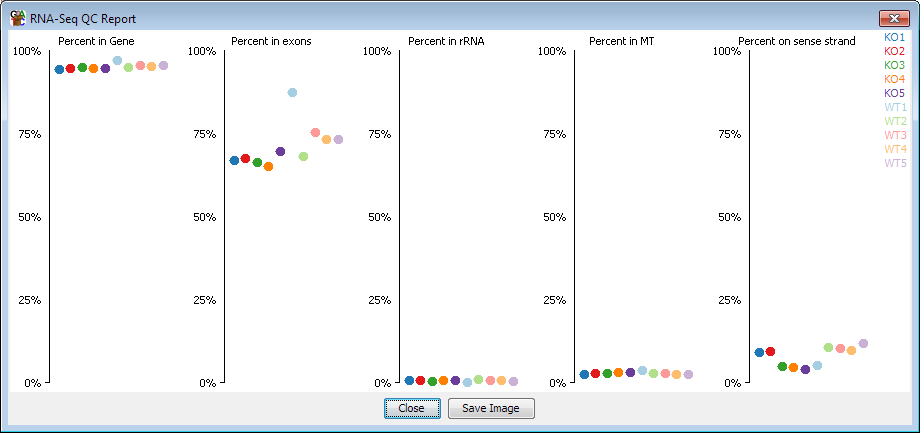
| rna_seq_qc_plot.png | 2020-07-20 14:44 | 17K | ||
| 3.2.13 The MA Plot.html | 2020-07-20 14:44 | 1.1K | ||
| 3.2.20 The Star Wars..> | 2020-07-20 14:44 | 1.5K | ||
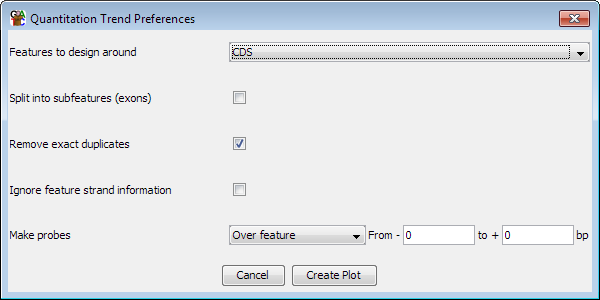
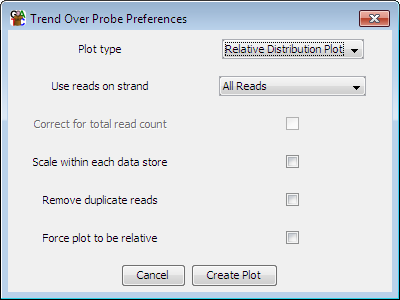
| probe_trend_preferen..> | 2020-07-20 14:44 | 15K | ||
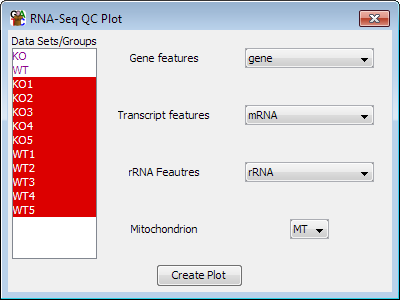
| 3.2.22 The RNA-Seq Q..> | 2020-07-20 14:44 | 2.4K | ||
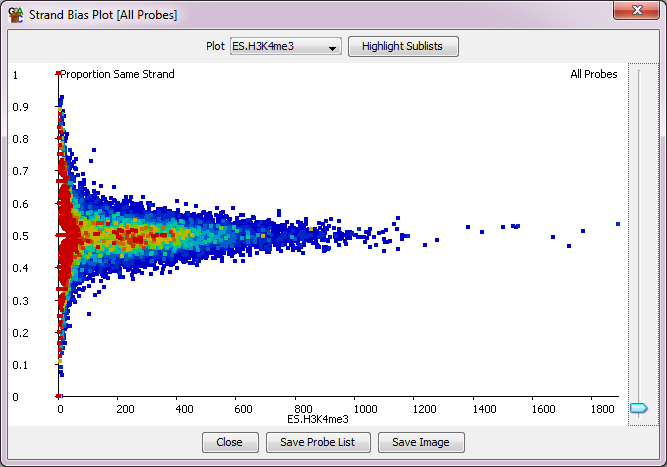
| strand_bias_plot.png | 2020-07-20 14:44 | 27K | ||
| bean_plot.png | 2020-07-20 14:44 | 35K | ||
| 3.2.3 The Probe Valu..> | 2020-07-20 14:44 | 1.4K | ||
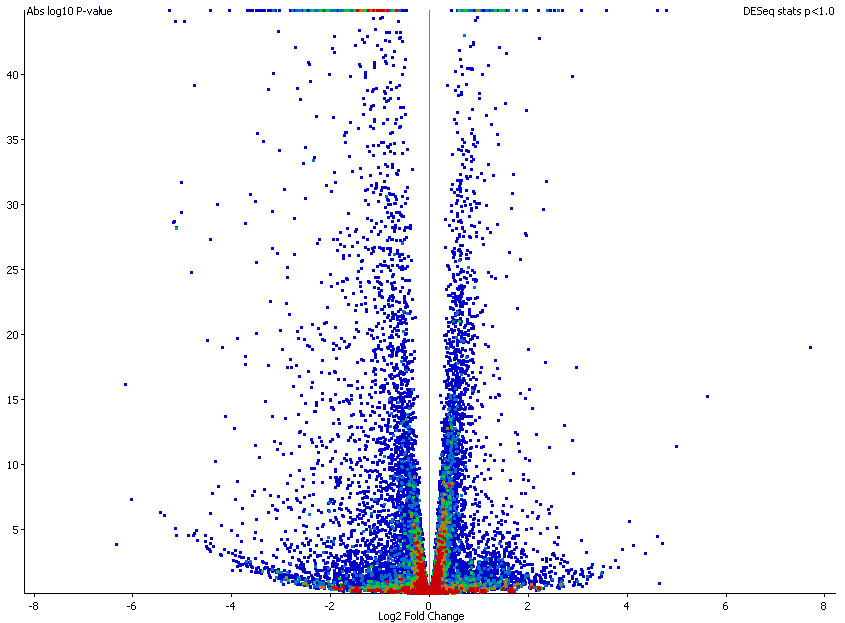
| 3.2.27 The Volcano P..> | 2020-07-20 14:44 | 1.6K | ||
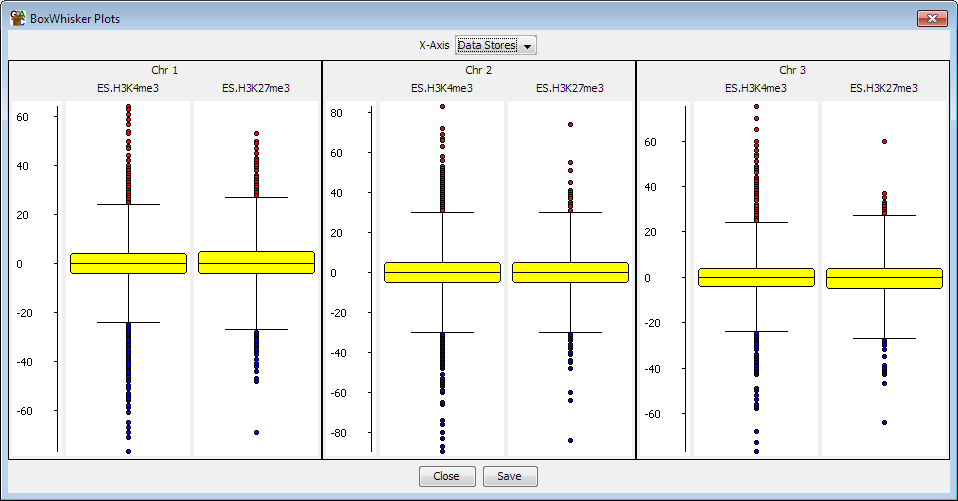
| 3.2.1 The BoxWhisker..> | 2020-07-20 14:44 | 2.2K | ||
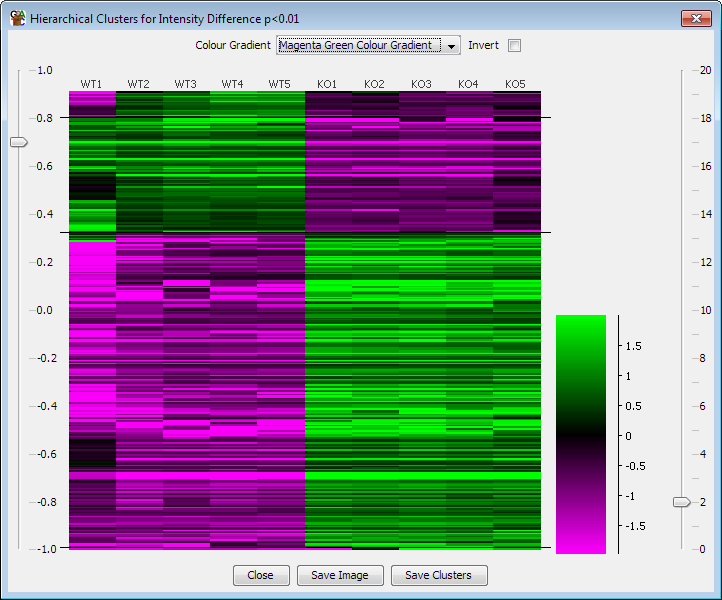
| 3.2.15 The Hierarchi..> | 2020-07-20 14:44 | 2.7K | ||
| correlation_matrix.png | 2020-07-20 14:44 | 11K | ||
| 3.2.14 The HiC Lengt..> | 2020-07-20 14:44 | 1.3K | ||
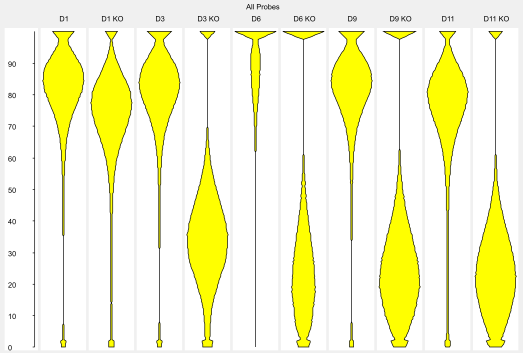
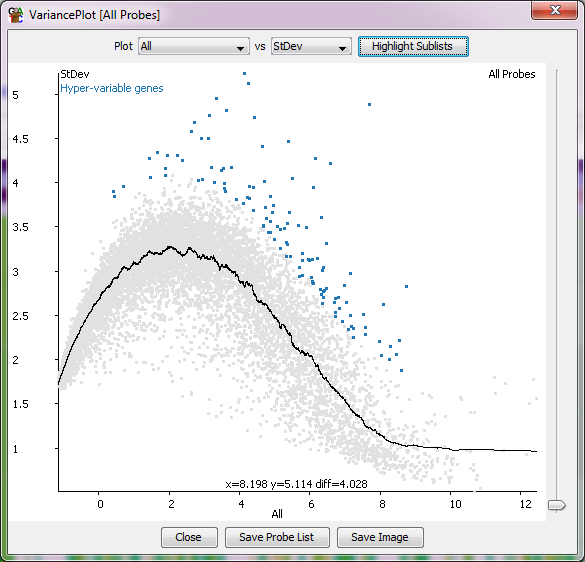
| variation_plot.png | 2020-07-20 14:44 | 37K | ||
| line_graph.png | 2020-07-20 14:44 | 77K | ||
| 3.2.18 The Quantitat..> | 2020-07-20 14:44 | 1.6K | ||
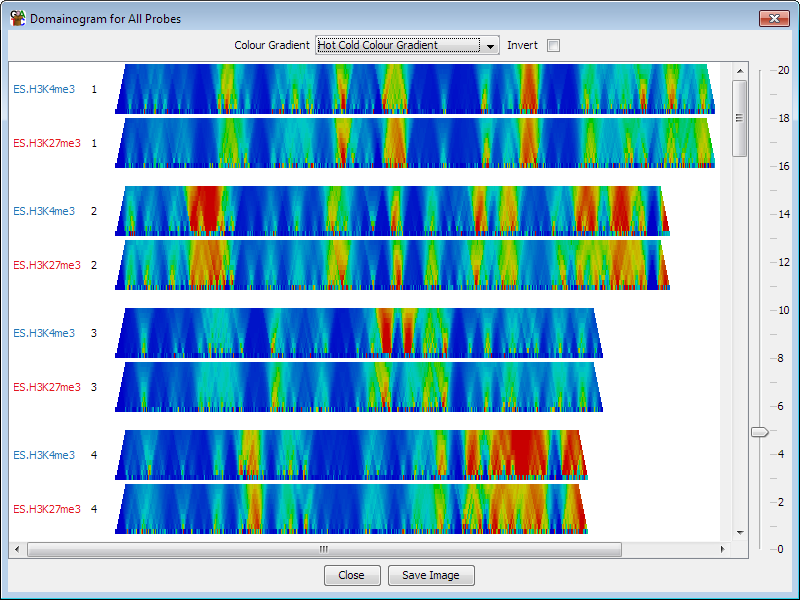
| 3.2.17 The Domainogr..> | 2020-07-20 14:44 | 1.9K | ||
| hierarchical_cluster..> | 2020-07-20 14:44 | 29K | ||
| probe_list_overlap_m..> | 2020-07-20 14:44 | 8.5K | ||
| probe_trend_plot.png | 2020-07-20 14:44 | 14K | ||
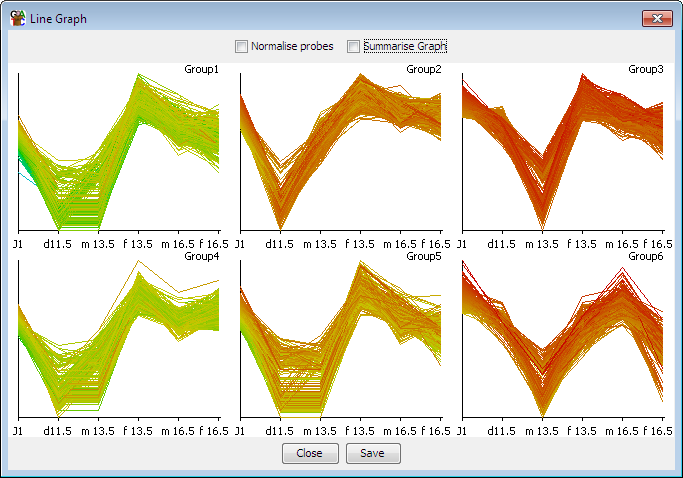
| 3.2.9 The Line Graph..> | 2020-07-20 14:44 | 1.8K | ||
| 3.2.19 The Probe Lis..> | 2020-07-20 14:44 | 586 | ||
| 3.2.12 The HiC Heatm..> | 2020-07-20 14:44 | 4.7K | ||
| 3.2.4 The Probe Leng..> | 2020-07-20 14:44 | 1.2K | ||
| rna_seq_qc_options.png | 2020-07-20 14:44 | 15K | ||
| small_rna_qc_options..> | 2020-07-20 14:44 | 15K | ||
| hic_heatmap_options.png | 2020-07-20 14:44 | 12K | ||
| aligned_probes_plot.png | 2020-07-20 14:44 | 62K | ||
| small_rna_qc_plot.png | 2020-07-20 14:44 | 16K | ||
| probe_value_histogra..> | 2020-07-20 14:44 | 8.8K | ||
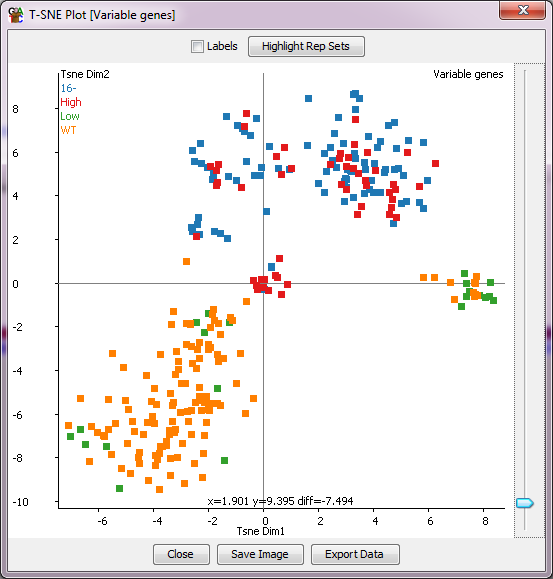
| 3.2.26 The TSNE Plot..> | 2020-07-20 14:44 | 2.7K | ||
| scatter_plot_sublist..> | 2020-07-20 14:44 | 7.5K | ||
| 3.2.11 The Cumulativ..> | 2020-07-20 14:44 | 1.8K | ||
| 3.2 Figures and Grap..> | 2020-07-20 14:44 | 2.7K | ||
| aligned_probes_prefe..> | 2020-07-20 14:44 | 12K | ||
| hic_cis-trans_scatte..> | 2020-07-20 14:44 | 6.1K | ||
| 3.2.25 The Bean Plot..> | 2020-07-20 14:44 | 1.7K | ||
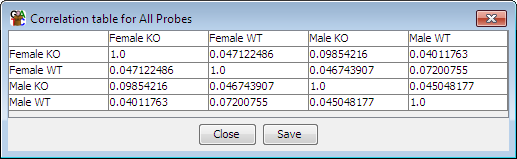
| 3.2.10 The Correlati..> | 2020-07-20 14:44 | 755 | ||
| tsne_plot.png | 2020-07-20 14:44 | 26K | ||
| hic_length_histogram..> | 2020-07-20 14:44 | 12K | ||
| 3.2.24 The Variation..> | 2020-07-20 14:44 | 1.9K | ||