Exercise 6
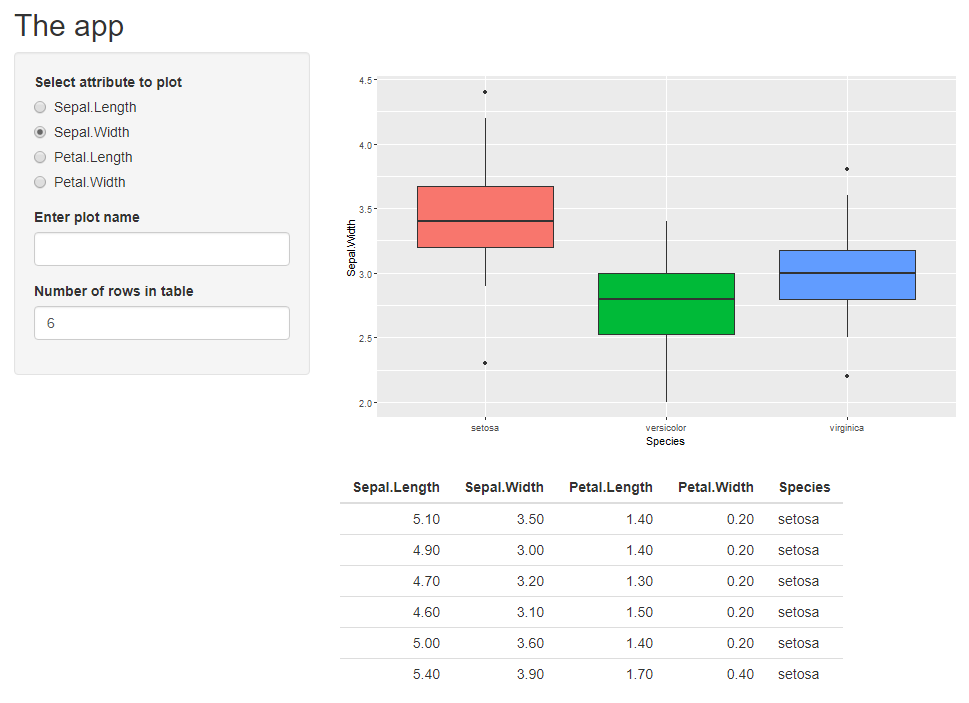
Create an app that looks like this one (minus these instructions), using the sidebarLayout and the iris dataset
- In the sidebarPanel, create radio buttons to select between sepal length, sepal width, petal length and petal width
- In the main panel, create a boxplot showing the attribute selected from the radio buttons for the 3 different species.
- Add a textInput to allow the user to name the plot
- Show the iris data in table format below the plot
- In the sidebar, allow the user to select the number of rows to be shown
[Optional]
- Move the plot and table in to separate tabs
- Add another tab with a table showing the mean and standard deviation for the selected attribute